Metric 4 Pillars
Home | About MapMetrics | Selecting Great Metrics | Using XMR Charts
Where most groups fail and a leading reason why logistics managers and directors are fired or passed over is they fail to understand that perception is always realty. Not only must the metrics be met they must be clearly shown to be met and questions must be addressed quickly and clearly. Without performing the latter perception is always "shipping is the problem" and you are dealt with accordingly.
A tool is needed to report and respond to questions about metrics. Map Metrics is specifically built to be this tool for transportation professionals. The Map Metrics 4 pillar support approach guarantees your success in reporting your metrics.
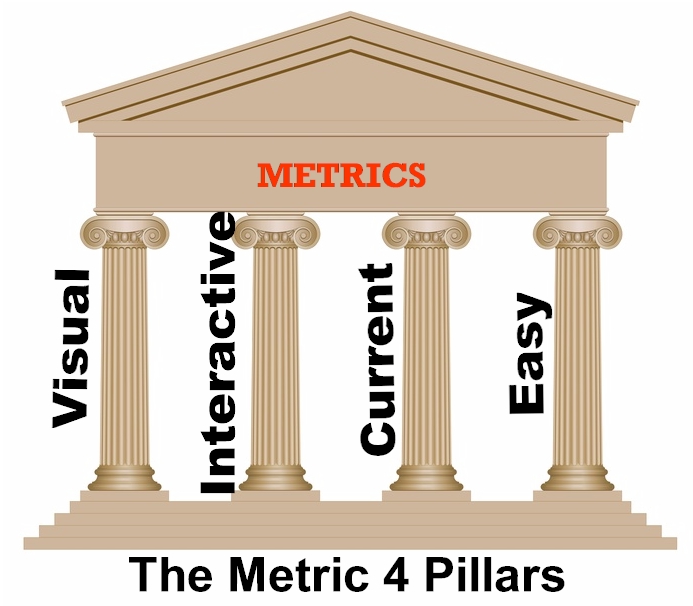
Current
What ever tool is used it must be kept current. At worst data should be available for the previous month within the first few days of the next month. However best practices dictate the data should be updated much more frequently.
Easy
The tool should be easy to use. At best the tool can be released to all levels of management who may question your performance at worse the tool can be utilized in management meetings. Thus using that complex Excel spreadsheet should be the furthest from your mind as others will not be able to use it and you will be sure to fumble during "what about" questioning.
Visual
Your audience should quickly see at a glance whether your metrics are being met. Information should be portrayed graphically in a clear manner. Make reporting metrics fun.
Interactive
The tool should allow for "what about questions" in that you need to be able to slice and dice the data instantly based on questions raised. You need to be able to drill down on data so that specific concerns can be raised, reason for not meeting a metric explained and action plans addressed.
561.571.BLUE(2583)
© Sky Blue Logistics 2015